Mathematical analysis
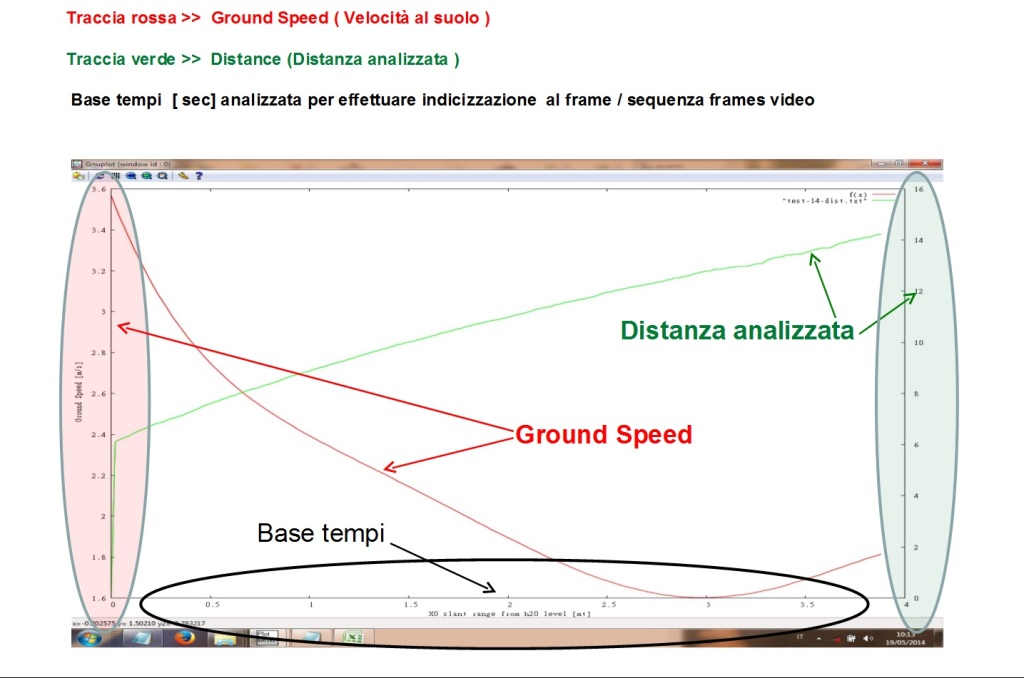
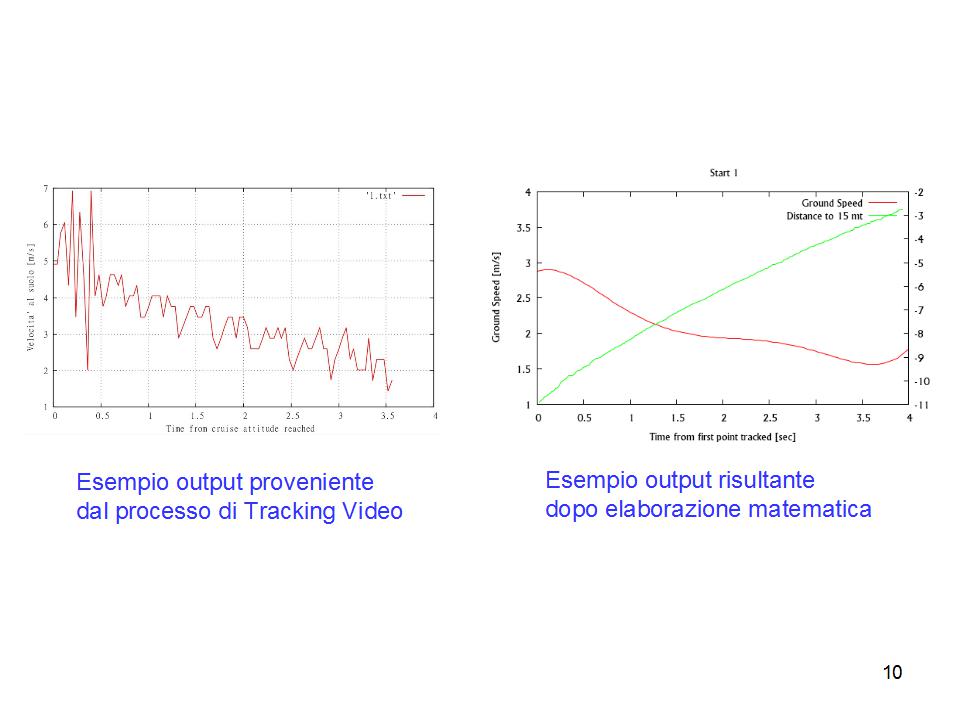
Graphic representation of speed and distance traveled
The process by means of mathematical processing applied to the numerical representation produced from the phase of video tracking , which produces as a result a number of physical quantities related to the event ( es. speeds progress , accelerations , angles , ) in different formats ( eg . numerical, graphical , etc. ) .
Re-calculation of frequency calculation (SR), amplitude (SD) and arm index (SI)
Among the main roles of a coach there and ‘ to help athletes find out the best combination of ampiezzae frequency of stroke , enabling the athlete to swim at the desired speed with minimal energy expenditure .
In this article we propose MORESWIM as a support of the coaches of a new method of calculating of stroke frequency and distanace that lends itself to a more accurate analysis of the swim.
To do this MORESWIM has revisited the traditional requirements that determine the frequency and amplitude calculation of strokes with a different approach based on modern video analysis tools
Evaluations conducted by MORESWIM have had as a database the results of some European competitions London 2016, Rome Settecolli 2016 relative to international athletes.
Development of MORESWIM methodology
Definition
To begin with the classic definitions:
” Stroke cycle – SR”
For stroke cycle is defined as the time it takes from when a swimmer does enter a hand in water at the time when that same hand, traversed all stages of the stroke, enters again (and then a stroke cycle in Free Style water will consisting of a left stroke, a stroke right to complete again when the left hand will fall into the water)
“Distance for stroke – SD”
It represents the measure of how we move forward in the water with each arm stroke and is expressed in meters per cycle
“Stroke Index – SI”
This index expresses a relation between cycle and amplitude of stroke, is expressed in m 2 / s that does not have a real physical meaning but represents a simple practical application to a monitor at the same time the trend of the cycle and amplitude (eg. The parameter SI decreases with increasing SR)
Methodology for the Cycles and width of strokes traditionally followed the race analysis and based on video analysis process
The scenario chosen by us is related to a race situation with high level athletes . The method is based on video analysis processes. Leaving aside all aspects related to the accuracy and calibration of cameras, placement of rooms and equipment used for video analysis used we will focus on what is usually the source data base on the basis of which will be derived the parameters of interest to us.
Parameter list output of the video analysis process:
- Start Block release time (sec): from the start event to the time when the feet leaved the block
- Path Time (sec) : is the time until when the head reach each distance Test_Point (TP_xx) where xx = 5, 15, 25, 35, 45, 50 meters (for races up to 400 meters), for races above 400 mt TP_xx is checked every 20 meters.
- Time mark of each single stroke cycle (instead of 3 cycles adopted in the classical method)
- Time of marks – 5 meters : is the time the athlete spents to cover last 5 mt of track (TP_END – 5)
Output parameter list of the process mathematical processing:
- Stroke Rate (SR)
- Average speed of each Test_Pointd path (e.g. 5, 15,25,35,45 and 50 mt……..)
- Stroke distance (SD)
- Average speed during last 5 mt to turn phase
- Average speed during last 5 mt to end race
Comparison of the results with the traditional method provides quite significant conclusions. Infact this approach highlights some aspects in the application of this methodology as:
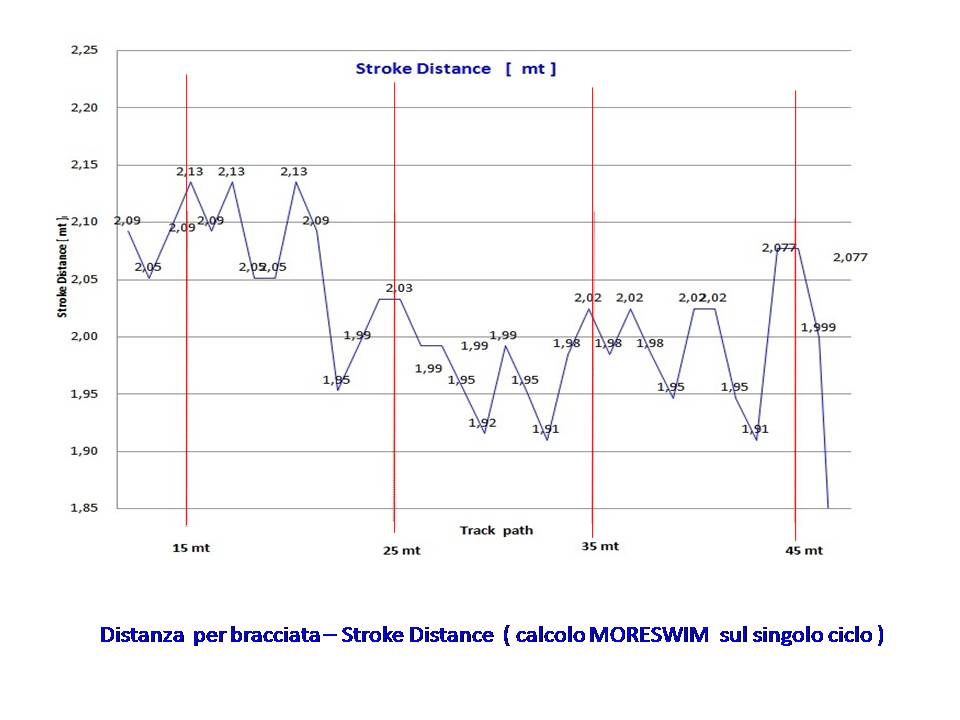
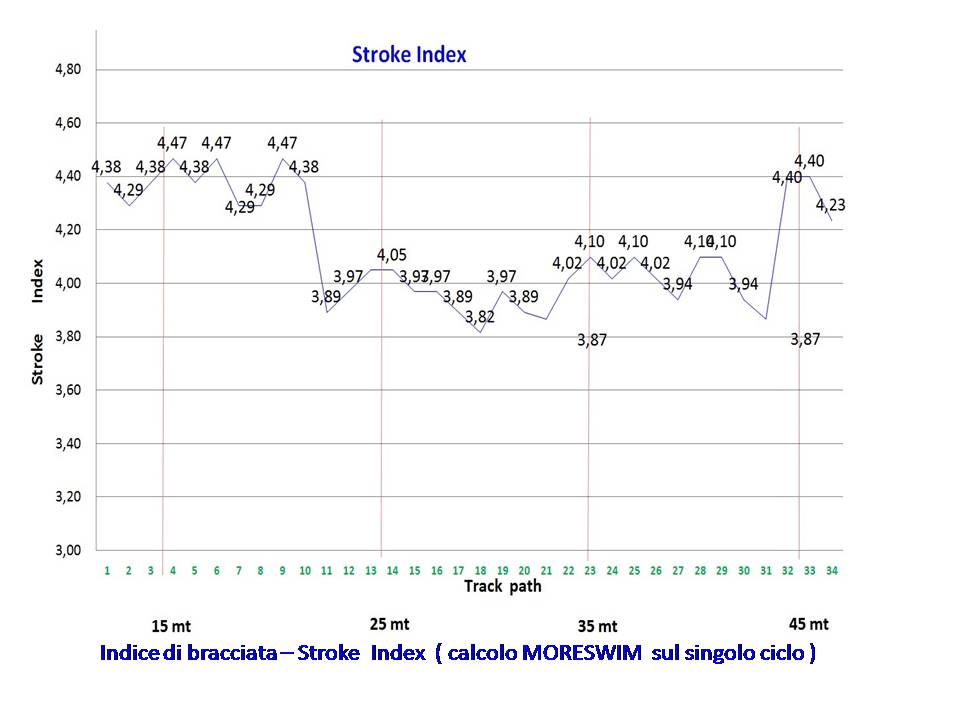
a) Greater sampling of the single stroke signal with a consequent increase in the sensitivity of the signal itself.
b) Possibility to extend the mathematical analysis of the frequency up to one cycle before the track end Test Point, covering in particular the last 5 meters of track.
c) Possibility of extending the distance stroke computation until the end track Test_Point, covering more precisely also the last 5 meters of the race.
d) Ability to highlight trends in the cyclical nature of a specific limb (eg. Dominance)
Below the results of the analysis limited to the calculation of Cycle and Amplitude of Arms of a race of the last London European Championships 2016.
Starting from the same basic data from the video analysis process are shown through still images and graphs the results of the calculation and representation of the SR SD and SI parameters, made with two different methods or “traditional and currency on the basis of three stroke cycles” and “MORESWIM which evaluates based on each individual stroke cycle.
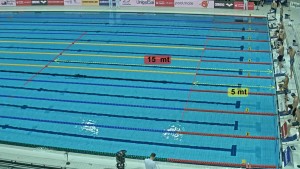
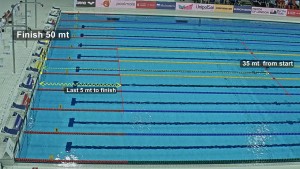
Example camera Fields of View involved :
1) Fixed camera with the field of view being from 0 m to 15 m
2) Fixed camera with the field phase of arrival view between 35 mt and 50 mt
3) Mobile camera with the field of view focused on lane No. 4
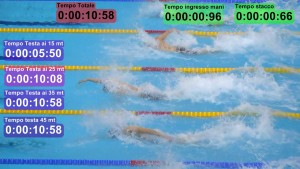
3 – mobile camera with the field of view focused on lane No. 4
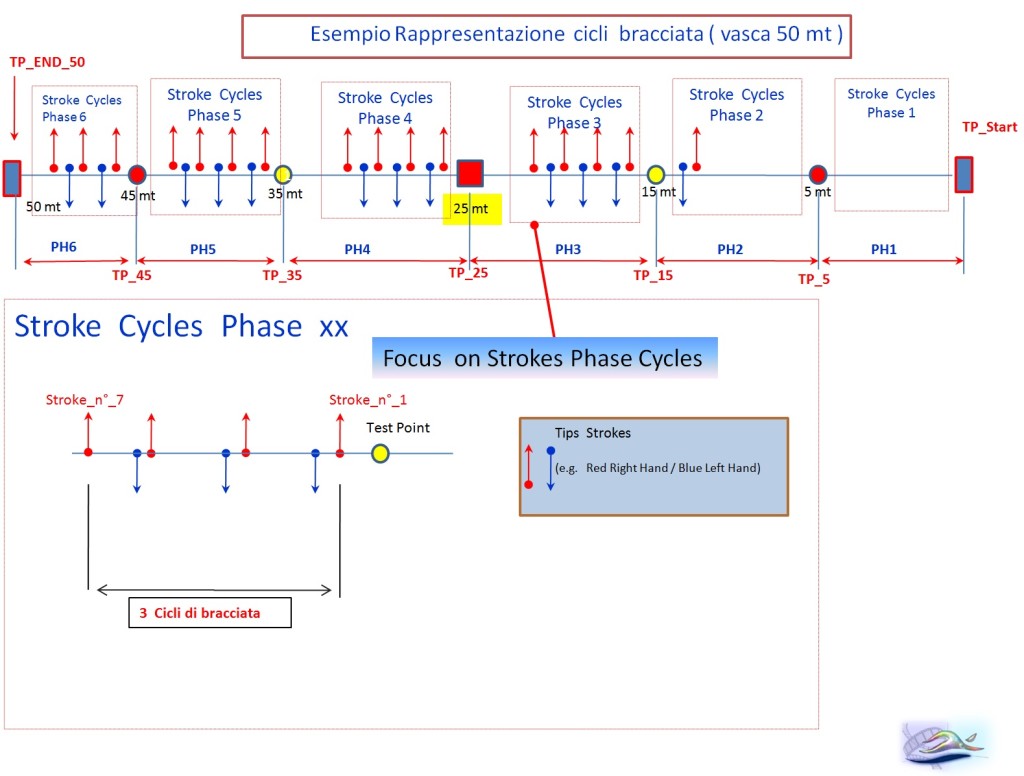
Assumptions diagram representation stroke cycles considering 50 mt track
The following diagram shows a hypothetical track breakdown and the related Times Test_Points harmonized with a stroke cycles sequence. Looking at this schedule you can see for example that is in Phase 2 (distance of between 5 and 15 meters underwater emerging from the principle of 3 cycles is difficult to be applied) and unchanged in Phase 6 (the last 5 meters are not able include the three cycles).
4) Example of video process marking of time references to Test_Points
httpv://youtu.be/5DgC0ByZpB8
5) Example video process marking each stroke from start (36+ e.g .final touch)
httpv://www.youtube.com/watch?v=OG0Z9ftkJA0
Numerical Example output from process MORESWIM video marking
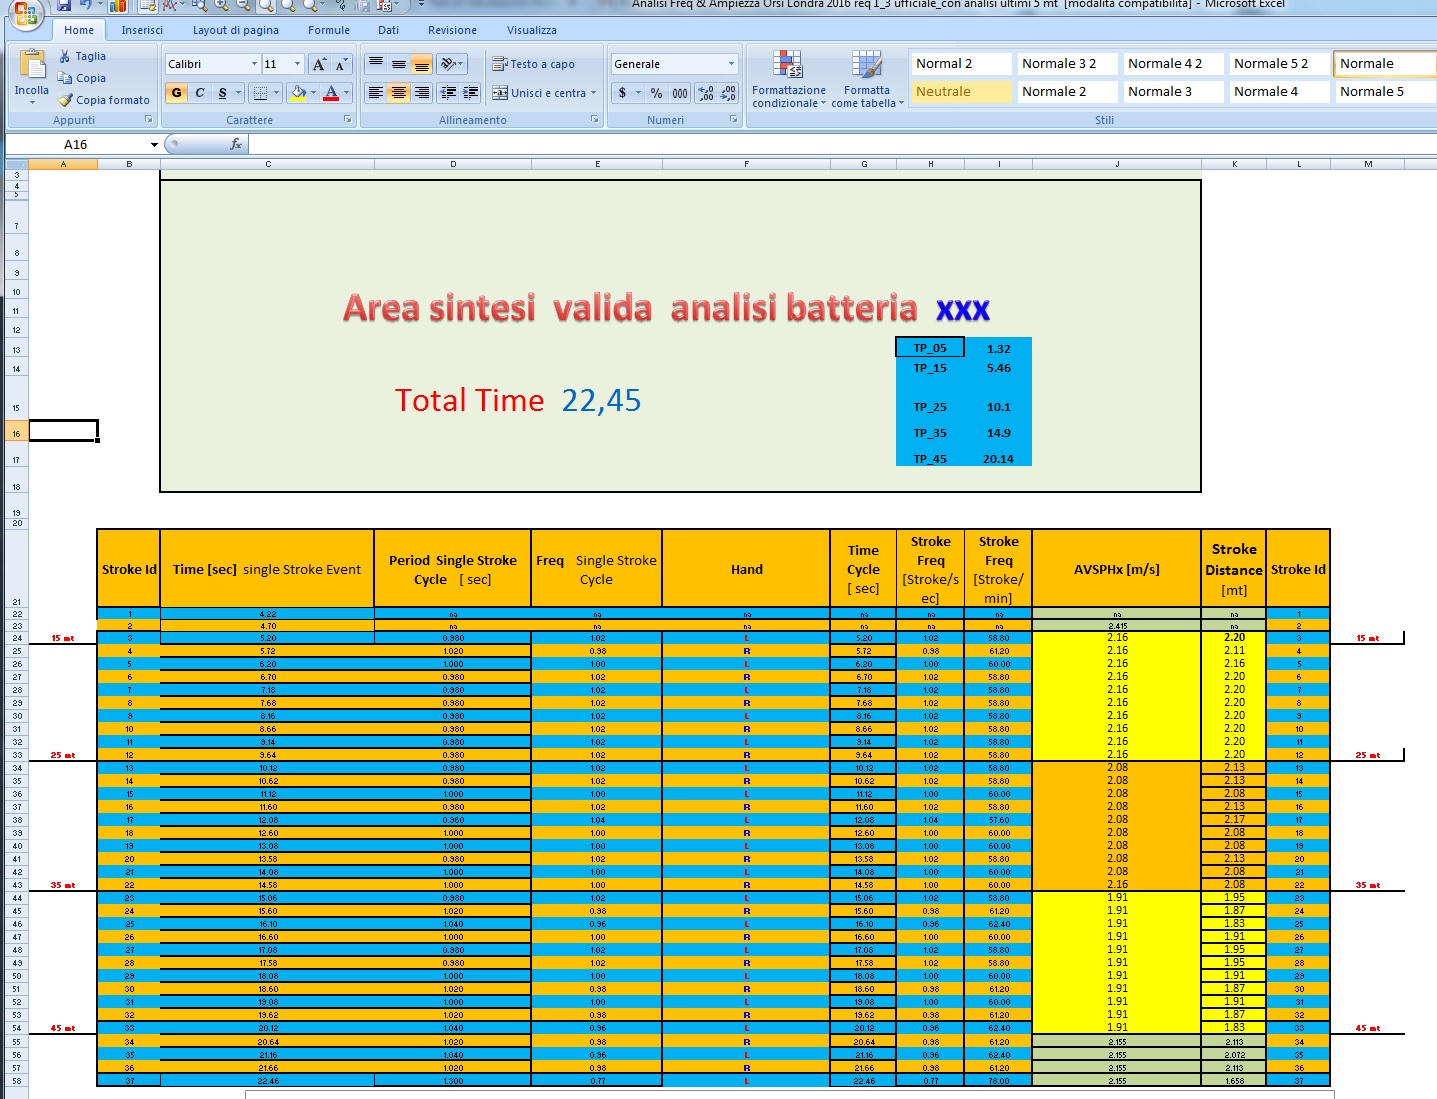
The following tables show some stages of MORESWIM process, which through video marking activities and subsequent export in numerical form will power the math process.
Step 1 – Detection and time exporting of head at various distance Start Point
Step 2 – Processing data exported in Step 1 as average speeds , test point distance partial time
Step 2 – Base tempi passaggio test point & elaborazione velocità media di tratta
Example of MORESWIM’s output process mathematical processing
The following table shows some sample data areas produced by MORESWIM’s algorithm for subsequent graphic and / or numerical plotting of SR , SD and SI parameters.
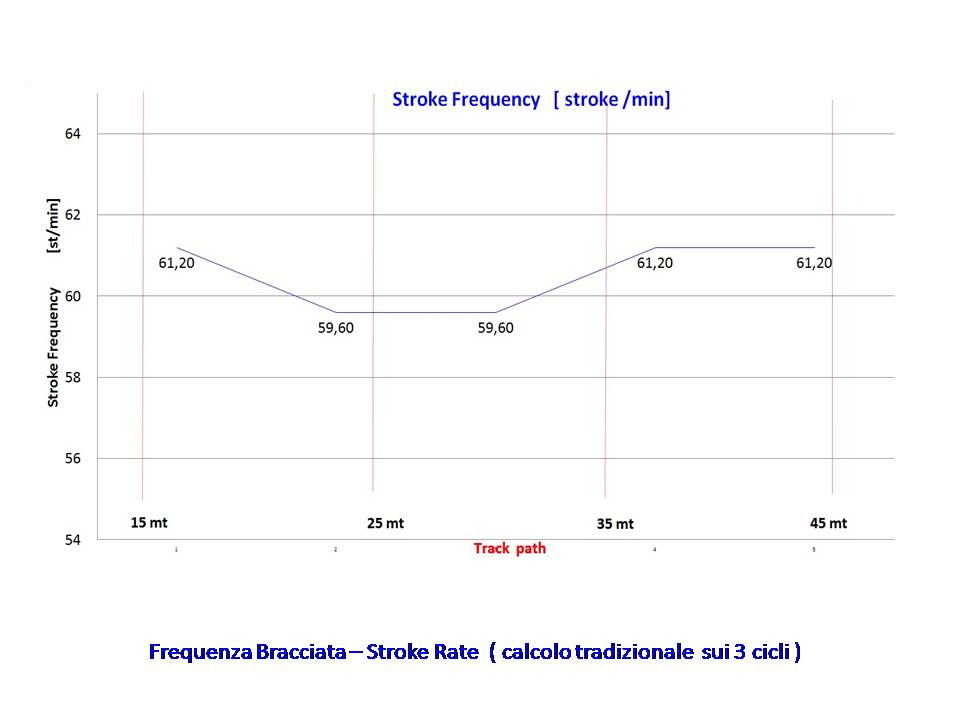
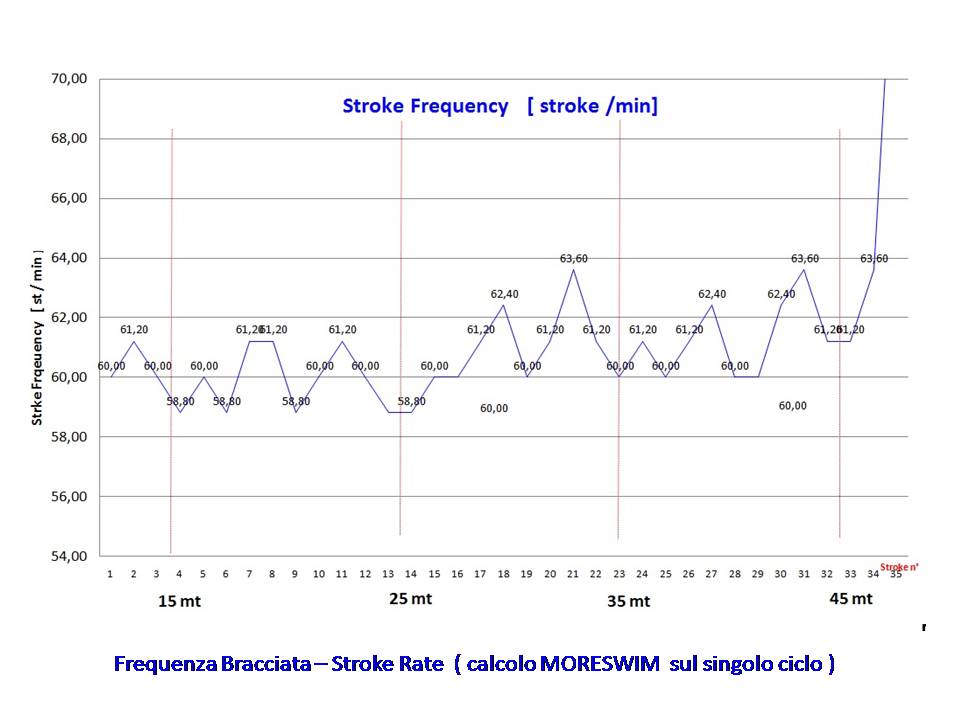
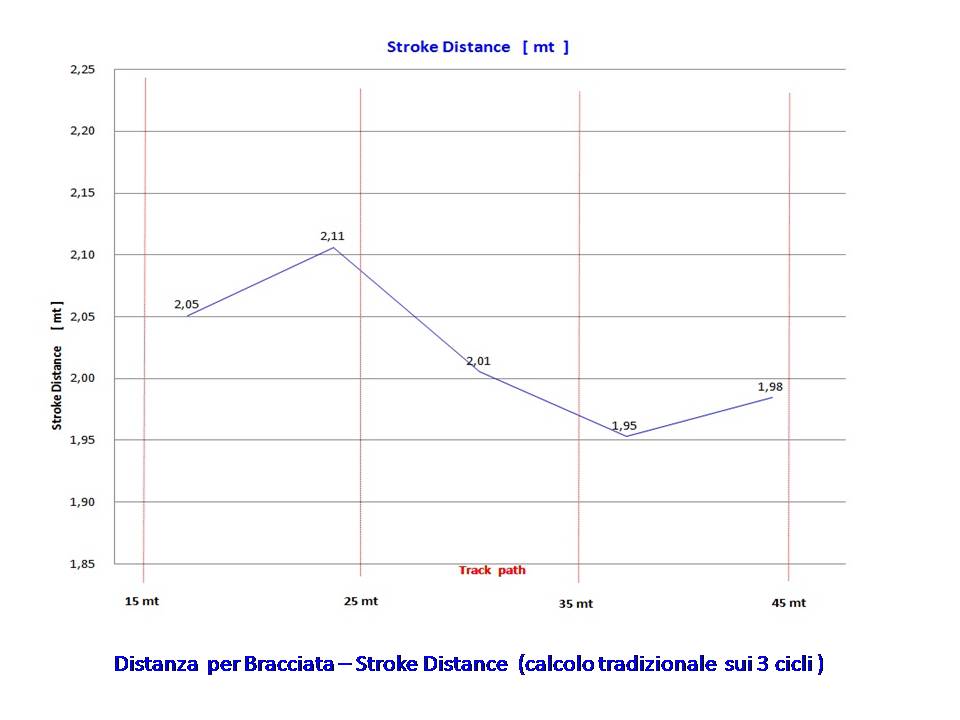
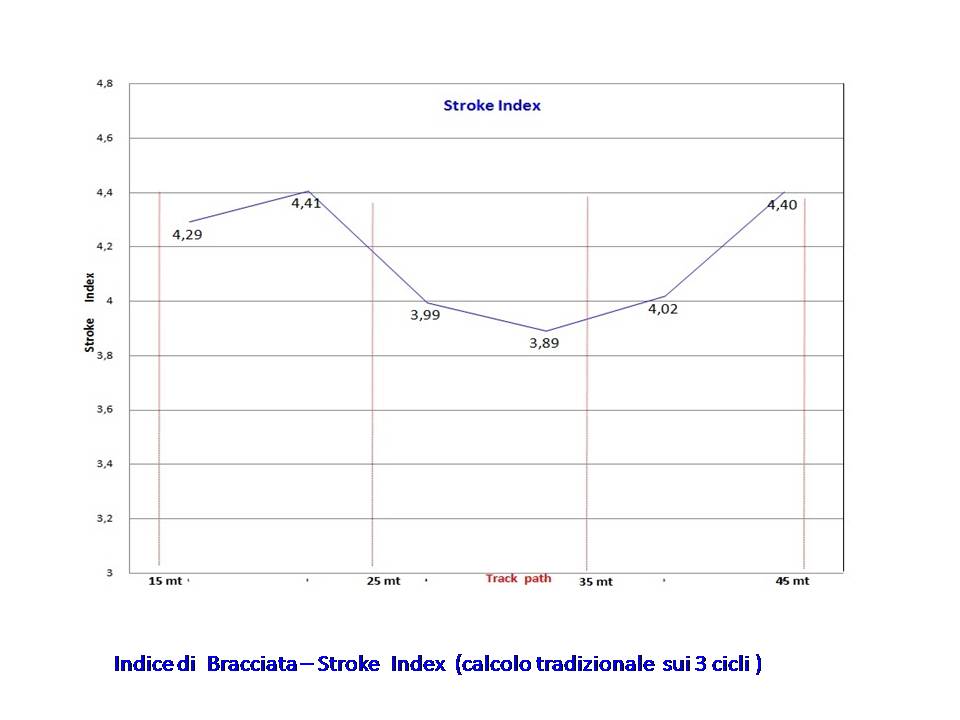
Comparison of final results in graphical form between “MORESWIM 1 cycles rating” and “traditional 3 cycles rating” relative to SR , SD and SI process calculation
The data represented below were been produced by automatic MORESWIM process using as initial numerical data set the result of MORESWIM videotracking export data process of one London 2016 50 mt free style battery qualifying then applying both SR and SD calculation method relative to performance of same athlete.
Stroke Rate evaluation – traditional method 3 cycles
Stroke Rate evaluation – “MORESWIM” method 1 cycles
Stroke Distance evaluation – traditional method 3 cycles
Stroke Distance evaluation – “MORESWIM” method 1 cycles
Stroke Index evaluation – “traditional” method 3 cycles
Stroke Index evaluation – “MORESWIM” method 1 cycles

